Remote Sensing — Time Series
Phenology in Southwestern Burkina Faso
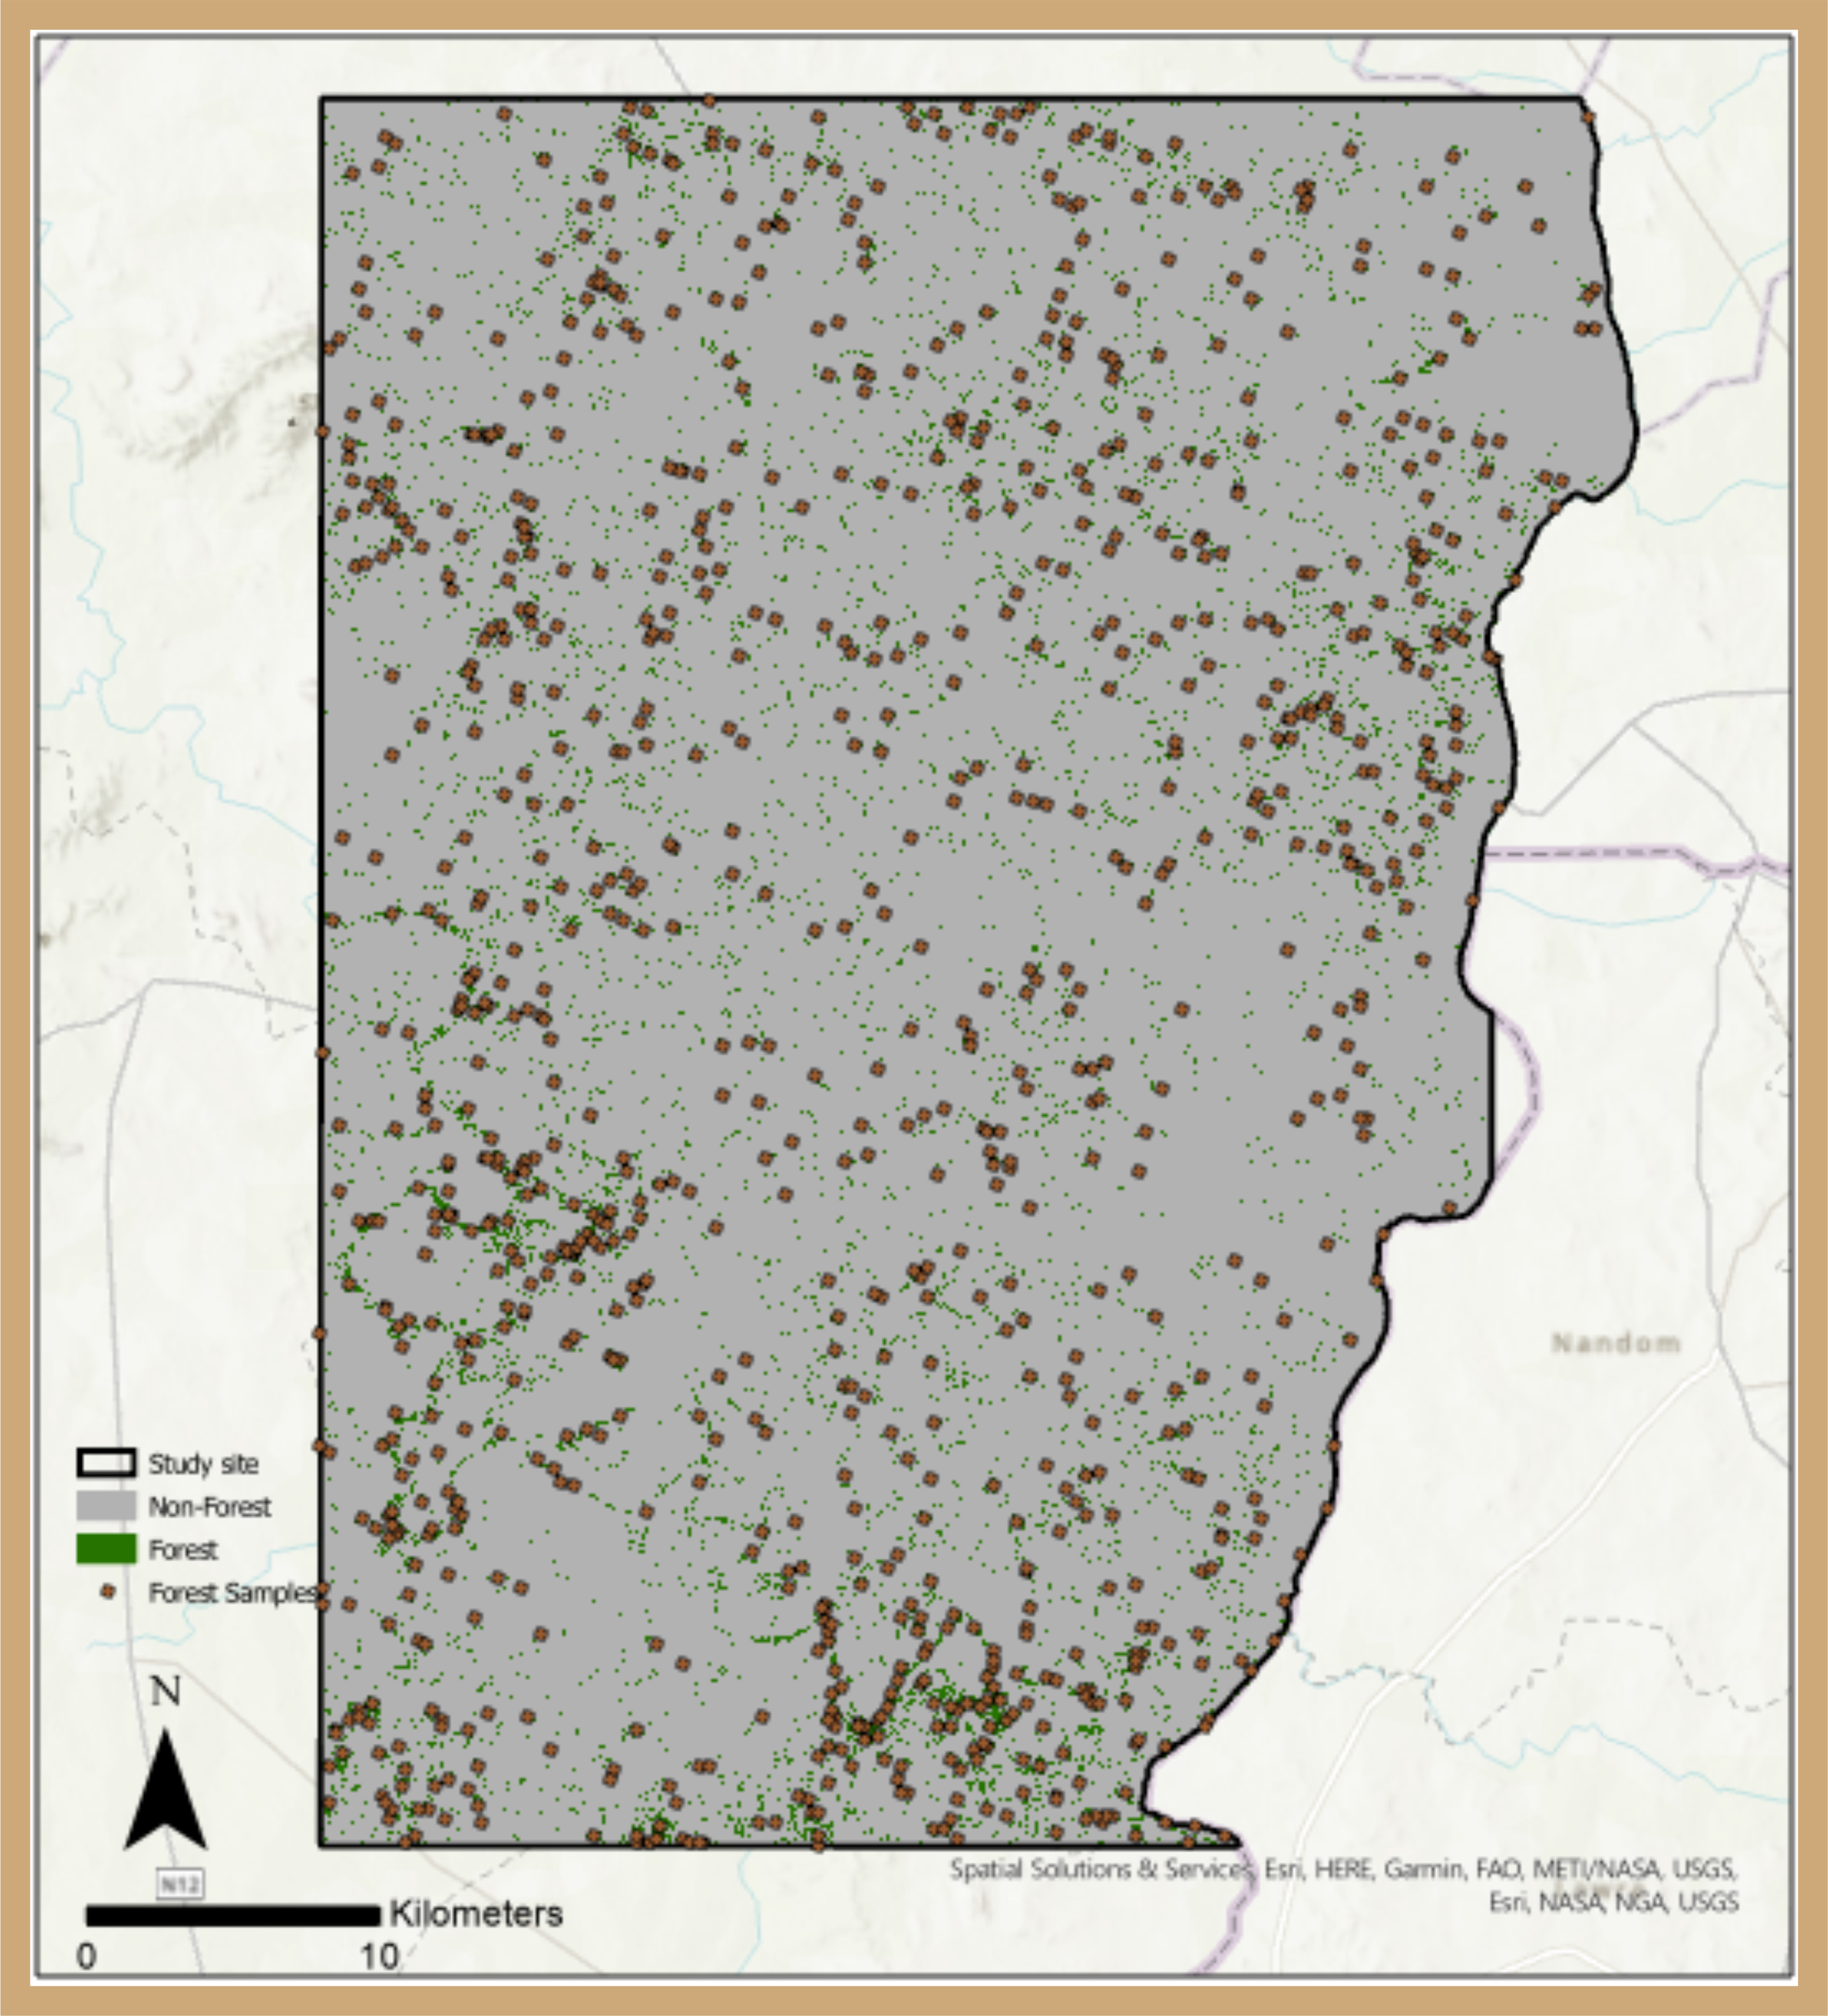
I was privileged to collaborate with extraordinary professors from UMBC and Penn State on their research into the relationships between maternal diet and forest structure in Southwest Burkina Faso. We explored the landscape’s phenology to understand whether the study had been conducted in a typical year for the region, and to determine potential variations in forest seasonality, and thereby forest food availability, across the study region. I calculated key seasonality metrics* using 20 years of cleaned and processed satellite imagery data** for 1000 randomly sampled forest sites. Similarly, I also collected and analyzed precipitation and temperature data.*** Lastly, I applied the Kriging interpolation method across the study region to the phenology, precipitation, and temperature datasets to see how these metrics played out at the specific household locations. Despite the El Niño effect, we learned that 2014 was a relatively representative year for seasonality and climate and that the regional seasonality gradient would be important to consider in the study’s modeling.
Software and Data Citations:
* Gianluca Filippa (2017). phenopix: Process Digital Images of a Vegetation Cover. R package version 2.4.4, https://cran.r-project.org/web/packages/phenopix
** I collected 250m MODIS EVI and NDVI data via: AppEEARS Team. (2022). Application for Extracting and Exploring Analysis Ready Samples (AppEEARS). NASA EOSDIS Land Processes Distributed Active Archive Center (LP DAAC), USGS/Earth Resources Observation and Science (EROS) Center, Sioux Falls, South Dakota, USA.
*** CHIRPS Data (Funk et al. (2015). Scientific Data, 2, 150066. doi: 10.1038/sdata.2015.66) and CHIRTS data (Funk et al. (2019). Journal of Climate, 32(17), 5639–5658. doi: 10.1175/JCLID180698.1)


